Tag Reference
This article introduces the Tags used in Fluent Designer. It includes a brief description of each Tag, as well as some tips about using Tags: inserting, deleting, naming and more.
There are also links to specific Tag reference articles.
What Are Tags?
A Tag essentially performs these actions: When the report template's output is generated, go to the data source, find the data that I tell you should be in the output, and insert that information in the output in the place where I tell you. In broad terms the Tag knows what data to insert based on the way it is defined, and where to put the data based on its location in the report template.
In programming terms, a Tag is simply a query executed against a database or other data source.
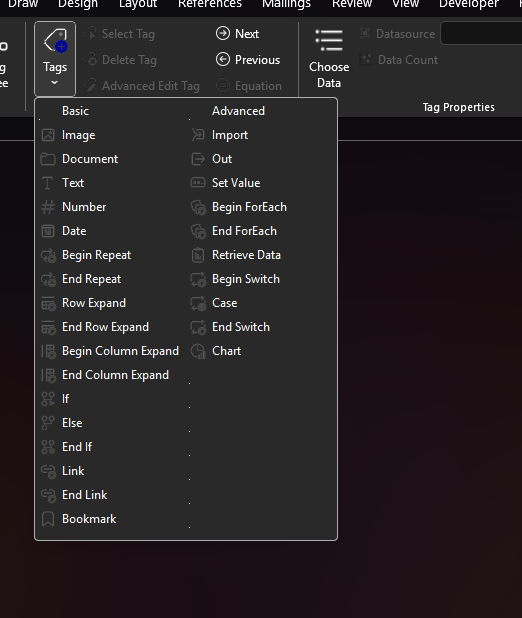
The Tags will appear as a button in the Fluent tab in your Office product command ribbon. See the Fluent Designer User Interface Reference for more information.
For example, below we see the "Tags" button in the Fluent tab in Word's command ribbon.

The Tags
Tag Colors
Once you start associating data with your Tags, they no longer show their Tag-type name (e.g. "Out" Tag); instead they show part of the name of the data you associated, such as "Customers." To help you see a Tag's type with a glance, each Tag has an assigned color, which are noted below.
Stand-alone Tags
Some Tags are used by themselves; for example an Out Tag can be used to display one image, and an Import Tag can insert a sub-template into a report template's output.
Combining Tags with a Tag such as the ForEach Tag gives you a great deal of control over your report template's output.
Paired and Grouped Tags
Some Tags are composite Tags with a beginning and an ending Tag. Like a car, you have to turn it on to use it, and you have to remember to turn it off.
Some of these Tags must be used in conjunction with other related Tags in order to do anything. They may also require the incorporation of stand-alone Tags.
Brief Tag Introduction
| Tag Type | Tag Color | Stand-alone Tag? | Uses |
|---|---|---|---|
| Out | Blue | Yes | |
| Import | Purple | Yes | |
| Set | Chartreuse | No | |
| ForEach, EndForEach | Orange | No | |
| Query | Fuscia | No | |
| If, EndIf | Forest Green | No |
|
| Else | Fluorescent Green | No |
|
| Switch, Case, EndSwitch | Brick Red, Crimson | No | |
| Link, Endlink | Gold | No | |
| Bookmark | Blue | Yes | Use this tag to create clickable links to other sections within the finished document. |
| Chart | N/A | Yes |
Using Tags
Inserting Tags
Tag Nicknames
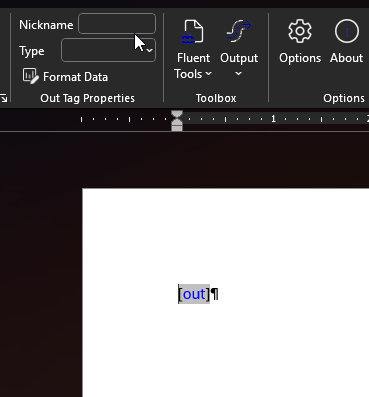
When you click on an inserted Tag, a "Tag Properties" section appears in the Fluent ribbon. It's an easy way to give a Tag a nickname (which we strongly recommend). There are different options depending on the type of Tag. Tag properties are described in each Tag's reference article.

We recommend as a best practice that you give your Tags nicknames. There are a few reasons:
- Naming helps others to be able to understand what you're trying to accomplish with your report template.
- Naming helps you remember what you're trying to accomplish with a report template if it has been some time since you used it and you don't remember.
- Naming can make your template look cleaner. When you associate a large amount of data to a Tag, the appearance changes to show you everything that is associated with the Tag.
Editing Tags
See our Tag Editor article.
Copying and Pasting Tags
We discourage copying and pasting Tags as it can wreak havoc in your report. You can freely copy and paste a Tag that has no data associated with it, however, once you assign data to it, you must be careful to select the whole Tag (brackets and all) in order to move it and keep all the data intact.
Deleting a Tag
It is important to use the Delete Tag button in the Fluent ribbon to ensure you have completely cleared the Tag's hidden code from your report template.
Where Can I Put Tags?
Tags can be added into the document body, headers, footers, footnotes, tables, and even into textboxes. But there are some limitations:
Excel Report Template Output Limitations
Do Tags Appear In My Report Template Output?
Rest assured that your final report will not have bits of text that say "Set Tag" or "Query Tag" or "EndForEach." Instead, the Tag is replaced by the actual data you assign to it. For Tags like the Set Tag or Query Tag, they simply do not appear in the final document. See the example for Tags and Table/Cell Sizes below.
Do I Create a New Row or Line for the Data I Want to Appear?
When you create a Tagged document, you do not need to create a row or add new lines for all the data you anticipate to be returned when you generate output. Instead, Fluent Designer automatically adds a row or line for each item that you tell it to; when you assign a set of data to a ForEach Tag, it will create a row for each new piece of data that matches all the criteria that you set for it. (See the next example.)
Tags and Table Cell Sizes
Even if your report template looks too busy, or the cell height seems incorrect, the final output will have evenly spaced rows that accommodate the data you assigned to it.
Here, the Tags have taken up enough space in the cell (under Product Name) that an extra line was needed.
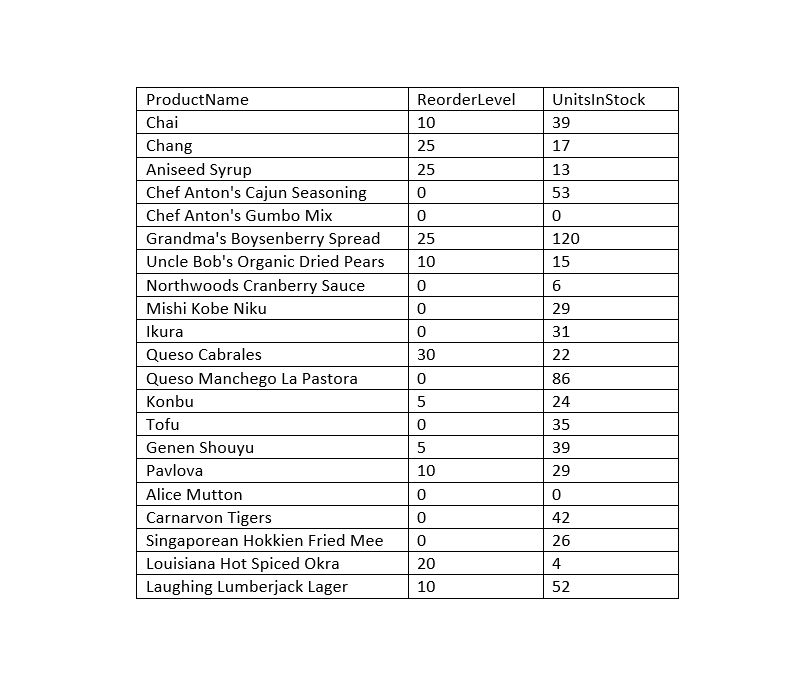
Upon output, the rows accommodate the actual text and number of rows of data that were selected.
Note that the all the Tags under the Product Name cell had no effect on the cell height, and that rows have been automatically added for each piece of data. In addition, there are no visible Tags in the final document.
