How Do I Use a Chart Tag?
Use the Chart Tag to insert a chart into your Report Template's output.
In this article we'll create a simple Chart Tag, connect it to a data source, then select the data to be displayed by the Chart Tag in the Report Template's output.
For more details about the Chart Tag, see the Chart Tag Reference.
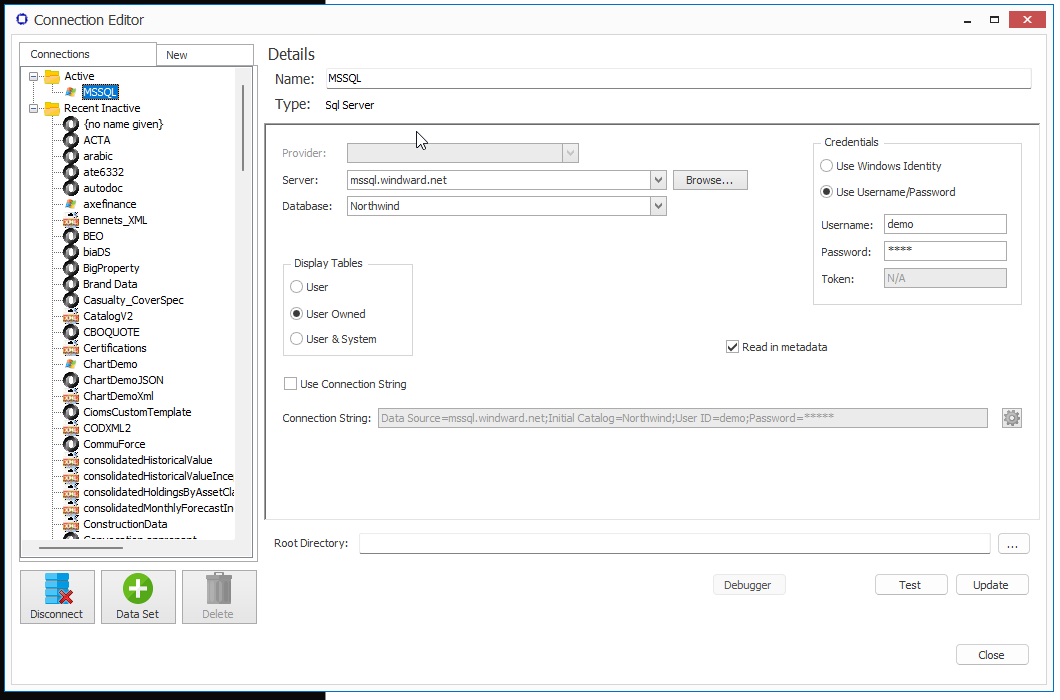
Open a new Word document, then connect to our public mssql.windward.net data source. If you're unfamiliar with connecting to a SQL Server data source, see How Do I Connect to Microsoft SQL Server?

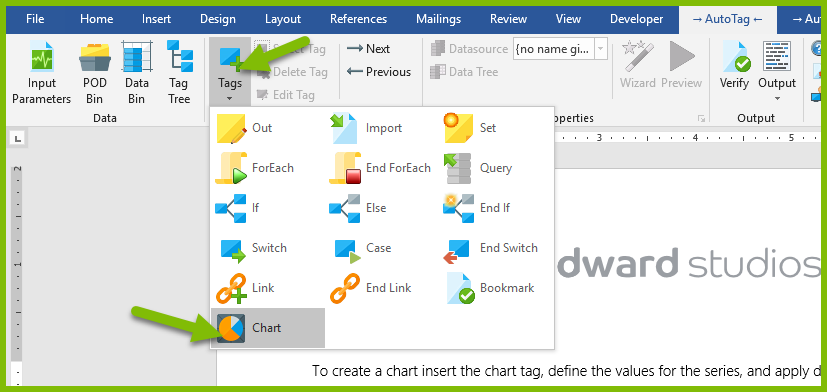
Click on the Tags button in the Fluent ribbon, then select the Chart Tag:

Double-click on the Chart Tag to bring up the Chart Tag Editor.
We wish to create a column chart of the yearly sales to several customers. First, in the Top Bar select the Column chart type:

In this example, the data we wish to display, like customer, sales amount and year, are in the OrdersByYear view in the Data Pane. Drag and drop the OrdersByYear view onto the "Select to return row(s)..." field at the top of the Select Pane to select the data. Note that a new "${series}" variable appears in the data tree in the Data Pane. We can use that variable to refer to the data we just selected in other queries in the Select Pane.

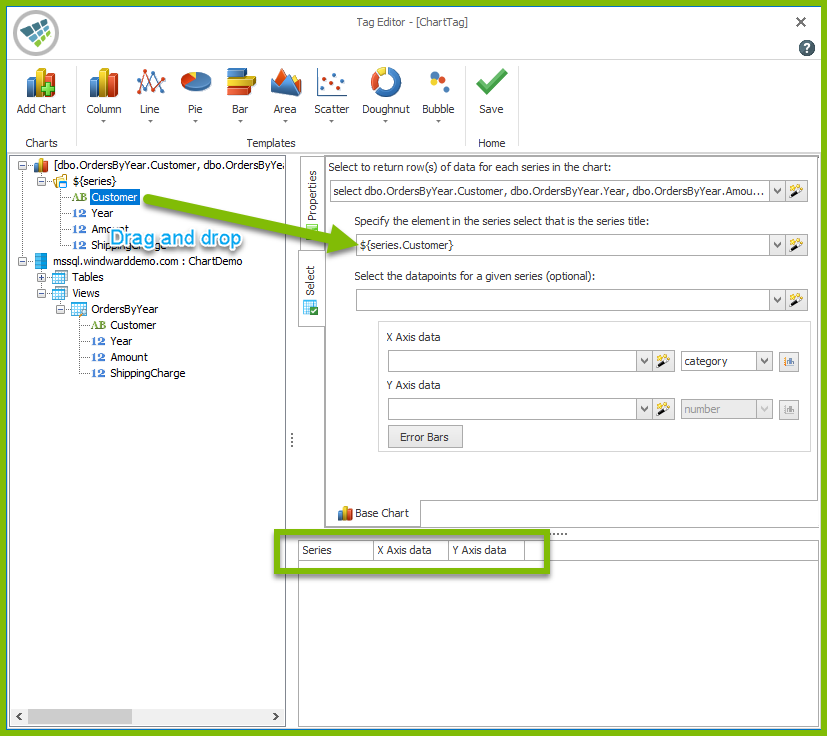
Now we will choose the names of the data series that will appear in the chart's legend. Let's choose customer names by dragging and dropping the Customer node in the ${series} data tree in the Data Pane onto the "Specify the element in the series..." field in the Select Pane. Note the change in the Results Pane.

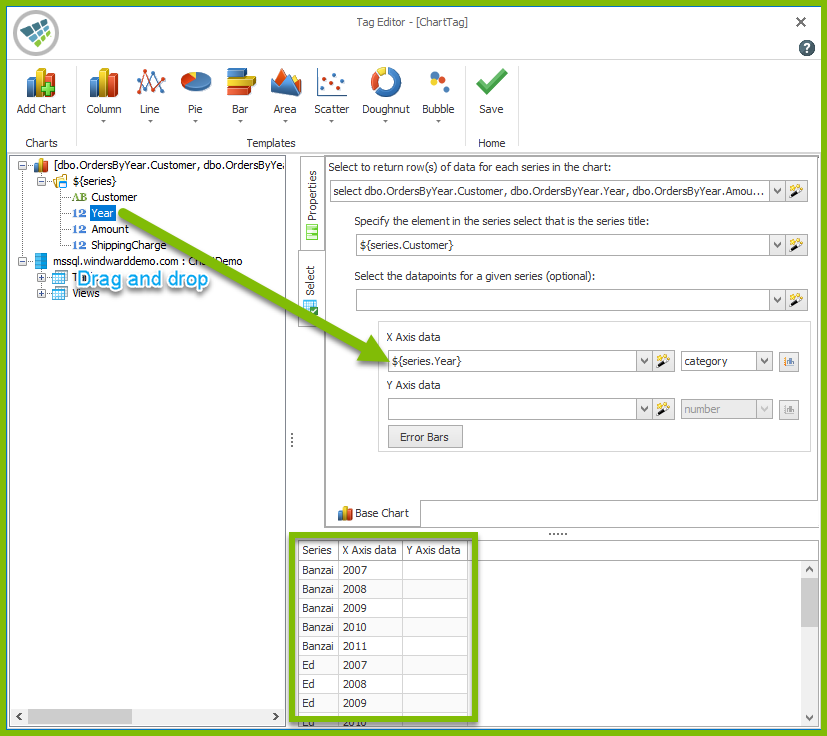
We'll plot the years of sales to customers against the X-axis. To do so, drag and drop the Year node from the ${series} data tree onto the "X Axis data" field. Note the change in the Results Pane.

Next, we'll plot the amounts of sales against the Y-axis. Drag and drop the Amount node from the ${series} data tree onto the "Y Axis data" field. Note the change in the Results Pane.

We're done! Now click on Save in the Top Bar to save the Chart Tag. Generate output from your template, and you will see the output from your first Chart Tag.
-4aebe00eebefb283921ca7ca49f3b27c.png)
Attached below is the template used for this example.