How Do I Use the OData Connection Debugger?
info
The OData Connection Debugger can be used to construct and debug connection strings for OData data sources.
With the OData Connection Debugger you can:
- Change and test connection strings and display the stack traces of failed tests
- Enter an Authentication Protocol
- Build connection strings by selecting connection string parameters
Open the OData Connection Debugger
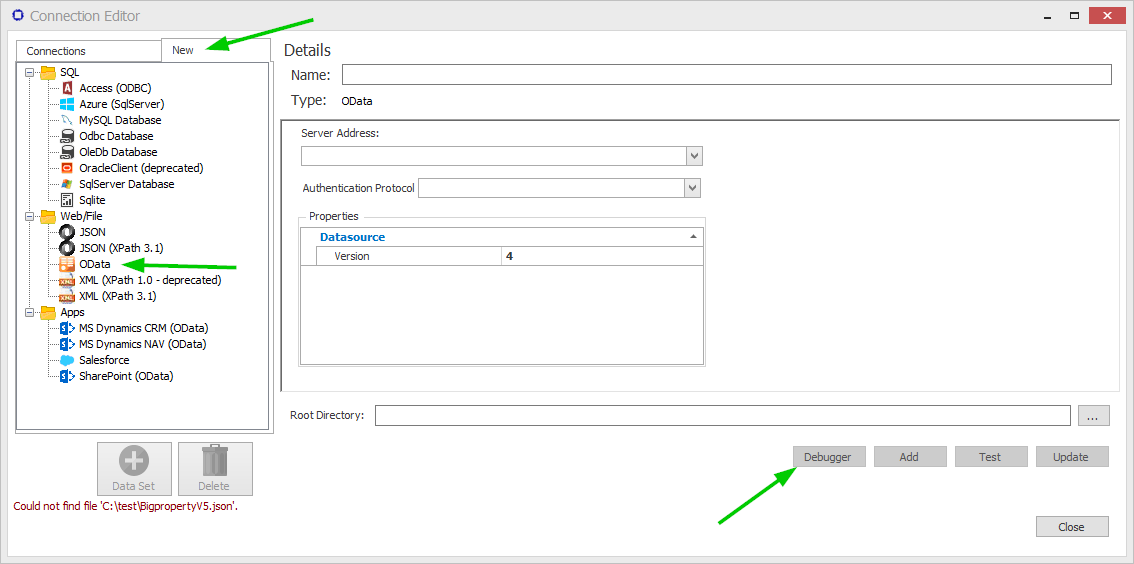
- After entering the details for a data source connection into the Connection Editor, click on "Test".
- If the test fails, a message will appear at the bottom of the Connection Editor.
- A failed test causes the "Debugger" button to appear - click on "Debugger".
OData Connection Debugger Interface
The Exceptions Pane
The Exceptions Pane shows the stack trace of any exception that occurred while testing the data source connection, or while changing the connection string within the debugger.

The Connection Pane
The Connection Pane is comprised of the URL that accepts OData data, an Authentication Protocol and Properties that can be set in order to specify parameters.